![]() I am excited to announce that the new 2.4 update that I’ve been working on for quite some time was finally released! As the title says, the most important feature of this update is a brand-new Statistics tab. Let me explain what’s it about.
I am excited to announce that the new 2.4 update that I’ve been working on for quite some time was finally released! As the title says, the most important feature of this update is a brand-new Statistics tab. Let me explain what’s it about.
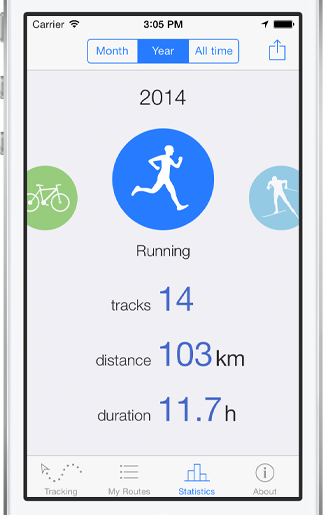
Up until now, the only thing you could do with your tracked routes as a whole was to view a long list of them, with one cell for each track. And it was working well; you could see all the details you needed for each of these tracks, separately. But you couldn’t see any totals, and that’s what the Statistics tab is all about – it provides activity-specific and time frame-specific summaries.
I had been thinking a lot about how to make this feature as easy to use as possible, while adding a playful element to it and making it useful for the most common use cases. I broke it down to this basic functionality:
How it works
1) choose between 3 timeframes:
- all time
- last year
- last month
2) choose activity for which you want to see the summaries
- all activities, cycling, running etc.
- ordered by track counts
3) view 3 totals:
- total tracks count
- total distance tracked
- total duration tracked
Now, this might sound like a lot of functionality that ultimately has to result in a complicated user interface, right? Usually it does, but I believe that I have found a way that makes all this very easy to do. And here it is:

Just swipe left or right to switch between activities using a nice parallax effect, and use the segmented control at the top to select a time frame. That’s basically it. Oh, and if you like to boast about your sport accomplishments, you can share a screenshot of this view right from the app, using the top-right action button.
The video
If you are new to Routie and are curious to know more, you can take a look at its website. To see complete list of what’s new, take a look at the App Store.
Pingback: Looking back at my year 2014 | Glimsoft()